Several months ago, I made a rough tool to visualize flight seasons for dragonflies (or anything else). I finally cleaned it up this week and put the builder online. The end result is that it’s very easy to make something like this:
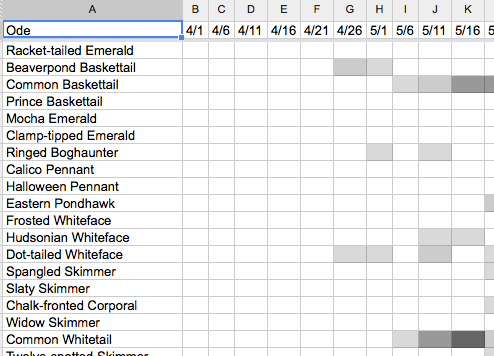
Darkness indicates the number of years observed for each segment (so the light ones are seen occasionally and the darker ones all the time more or less). Originally, this was embedded here but since it’s slow to load, there’s a screenshot and a link. Here’s another example: birds in Middlesex county by half months.
To make your own:
- Create a csv file with your data. You need name and date, but other fields are ignored so exports from AviSys or eBird or something are good.
Here’s an AviSys sample line:"Spatterdock Darner","Rhionaeschna","mutata","Prospect Hill","06/08/10", 1,"/m netted at base","MA","US"," ", 544
And an eBird one:
S6645808,Common Chaffinch,Fringilla coelebs,30694,5,CH-ZH,,Switzerland,47.3681293,8.5372353,07/25/1997,,eBird - Casual Observation,0,,,1,, Zurich Zoo
- Go to the seasonality charter and run your file through it. There are instructions there and it should be fairly obvious other than counting the fields.
- I’m using Google Docs but Excel or other spreadsheets should be similar. You can either upload the file to the web somewhere or paste it into the document (or create the document around it, but that requires more work every time you update).
- If you upload to the web, create the spreadsheet. In cell A2 enter the formula =importdata(“url-to-file”)
- If you copy and paste, paste into A2. In B2, use =split(A2,”,”). Select from B2 down to the B(whatever the last row is) and hit Ctrl-D to fill down. Now right click on column A and select Hide Column (click the little right arrow to unhide when you want to paste new data in).
- Add the date headings.
- Now to format and turn the pile of numbers into a nice chart. Select the entire range, the pick Conditional formatting from the Format menu.
- Create a bunch of rules like the screenshot below matching the text and background color. I used a breakdown of 1, 2-3, 4-5, 6-7, and 7+ for five levels of shading but you can use whatever.
- Add one last rule for Is equal to 0 and select white for text and background.

- You’re done! You can use the Publish to the Web option on the file menu to share or embed it like the samples above.
If anything isn’t clear, leave a comment or send an email. If you have large amounts of data, it’s probably better to ask me for the scripts and run them locally.